
 Helpful Posts:
 Hello,
I've been reading about raw capture on cambridge in colour as well as in this adobe white paper. I get stuck on understanding the linear gamma gradient at the bottom of page 2 in the white paper. I understand why the gamma corrected looks that way but I don't understand why the linear distribution/raw capture starts out that way.
Here is my thought process....
I'm imagining the CCD as an array of light 'buckets'. So, if you turn the image of the Linear Distribution gradient on it's side with the white on the top, it's one light bucket (each light bucket would be like a graduated cylinder used for liquids). Some buckets are completely filled with photons (we call this level 4,096). Some are half-filled (we call this level 2,048). And so, on... Why then is a half-filled bucket so pale?
What is this Linear Distribution gradient derived from? Where would middle gray appear in the Linear Distribution gradient as a percentile (12-18%?)?
I have a feeling that this has something to do about reflected light and logarithms but I am confused. I thought that the logarithms stemmed from perceptual issues and not actual light quantities (linear raw capture). I would have thought that the linear capture would have looked like the Gamma Corrected Distribution; then we would need to correct that raw data/standard incremental progression to better reflect what we perceive/see.
Can anyone help me understand this topic?
Thanks!
Results 1 to 12 of 12
Thread: Understanding Linear Gamma
-
16th February 2010, 07:43 PM #1New Member

- Join Date
- Feb 2010
- Posts
- 3
Understanding Linear Gamma
Last edited by McQ; 16th February 2010 at 09:23 PM.
-
16th February 2010, 09:12 PM #2
- Join Date
- Dec 2008
- Location
- New Zealand
- Posts
- 17,660
- Real Name
- Have a guess :)
Re: Understanding Linear Gamma
In a nutshell, you have to remember that our eyes don't have a linear response curve; we're very sensitive to small low-level changes, but totally insensitive to the same amount of change at high light levels. On the other hand, a camera sensor has pretty much a linear response right through the range.
Sorry - I'll add more if I get time today.
-
16th February 2010, 09:21 PM #3Administrator
- Join Date
- Apr 2008
- Location
- California, USA
- Posts
- 1,473
- Real Name
- Sean
Re: Understanding Linear Gamma
In that figure the linear distribution has been depicted so that the width of each of the 6 stop regions is scaled based on the number of levels it contains. This is to emphasize that fully half of the levels captured are in the brightest stop, and half of those remaining levels are in the second brightest stop, etc. I wouldn't read too much else into it -- particularly how bright the shades appear. They aren't intended to say anything about how we would perceive the image -- just where all the levels are allocated. In reality, a linear capture would appear much darker than its developed RAW file (with standard gamma correction applied during the RAW conversion). This is probably the source of your confusion...? Originally Posted by katheo

Another way of illustrating this is to use a gradient that *isn't* scaled based on the number of levels in each stop. The gradient below is used in the high dynamic range tutorial, and is scaled *roughly* how we perceive light levels:


Representation of How Bits Are Allocated for Increasing Brightness
That's a good analogy. Let's extend it so that each pixel is a bucket: Originally Posted by katheo
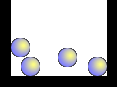
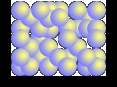
(left & right: mostly empty and filled buckets, respectively)
A half-filled bucket will indeed be very bright, since this is usually around one f-stop away from being a clipped highlight. However, the image itself will appear very dark, since most of the buckets will be nearly empty if the scene was properly exposed. In fact, a middle gray bucket will be only about 21.8% (for gamma 2.2 and sRGB). This means that for a typical mid-key scene (even distribution of shades), around half the buckets will be filled less than 21.8%. Only a tiny fraction would be filled more than 50%...
PS: there's some more on gamma in the following threads:
Understanding brightness and gamma
New CiC Tutorial Added: Monitor Calibration
...but be careful, when reading about gamma it's very easy to get more confused, not less
PPS: just in case the link ever gets broken, I've attached the Adobe Linear Gamma article you're referencingLast edited by McQ; 16th February 2010 at 09:40 PM.
-
16th February 2010, 10:21 PM #4

- Join Date
- Sep 2009
- Location
- Burton on Trent, UK
- Posts
- 4,788
- Real Name
- Steve
Re: Understanding Linear Gamma
I read that paper and thought it was only about exposing close to the right of a histogram to take advantage of the greater memory allocated towards the lower lights. But my histogram on the camera is only a luminance graph, and so if I'm photographing a predominately red scene how should I set exposure?
It is nice to know that although my histogram is showing blown bits or clipping the image isn't necessarily blown; something I suspected when doing pseudo or fake HDR or just even lowering exposure in photoshop or similar and seeing shape to the right of the histogram, but setting correct exposure is still guesswork based on experience. cheers
-
17th February 2010, 12:22 AM #5
- Join Date
- Dec 2008
- Location
- New Zealand
- Posts
- 17,660
- Real Name
- Have a guess :)
Re: Understanding Linear Gamma
Hi Arith, Originally Posted by arith
As a side note the "expose to the right" is a good theory, but it doesn't always work out the best in practice; depending on the dynamic range of the scene. A flat scene exposed to the right can be difficult to get looking normal in post-processing (mainly mid-tone areas)
-
17th February 2010, 01:02 AM #6New Member
- Join Date
- Feb 2010
- Posts
- 3
Re: Understanding Linear Gamma
Thanks for your replies.
I guess it all comes down to wondering 'what is this thing called bit allocation?'.
I was imagining initially that, say, 100 photons in pixel bucket 2 would register a certain voltage and stored in memory as the binary equivalent of the number 100, and so on. Straight numeric conversion of registered light values. It sounds more complicated than that.
Is there something ingrained in the hardware / sensor so that all photons do not register equally? Like a staircase with big steps at the bottom and smaller and smaller steps as you approach the top? What is it about the sensor that forces a larger allocation of bits for the highlights? Is it just an arbitrary decision? Why not just a regular old evenly-spaced staircase for dividing the tonalities? Or even, small steps at both ends and bigger steps in the middle?
Is this something like a digital equivalent of a 35mm film characteristic curve?
Thanks for your help! I really appreciate it.
-
17th February 2010, 01:52 AM #7Administrator
- Join Date
- Apr 2008
- Location
- California, USA
- Posts
- 1,473
- Real Name
- Sean
Re: Understanding Linear Gamma
The camera sensor does register photons more or less equally (ie, 200 photons gives a level roughly twice as large as 100 photons). It's our logarithmic* perception that is what makes it seem as though the bit allocation (steps) are smaller at the top (highlights) than at the bottom (shadows). The concentration of bits in the highlights only occurs when the gamma correction is applied to make the tones look perceptually uniform to our eyes. Originally Posted by katheo
*something with 4X as many photons only appears to be ~2X as bright
Hope we're helping . . . and not making things even more confusing!
-
17th February 2010, 03:02 AM #8
- Join Date
- Oct 2009
- Location
- USA - California
- Posts
- 445
Re: Understanding Linear Gamma
If it wasn't stored logarithmicly then images would have a serious case of banding. For example, open an image in PS and add an adjustment layer (Levels) and tweak the gamma to try to simulate a linear response (i.e. move the 18% (which is 50%) gray point so it's actually about 18% of the total bandwidth). Now flatten the image to remove the adjustment layer. Take a quick glance at the histrogram before you continue - banding has already started (especially if you're in a 8bpc image). Now add a new adjustment layer and "redo" the gamma correction (i.e. move 18% bandwidth mark back to the 50% bandwidth mark). Look at your histogram now. Notice how much information has been lost? Originally Posted by katheo
If you want to go one step further, re-import the origional image as a layer and do a A/B comparison of the two. If you pay attention you'll notice subtle yet significant quality loss on the image thats gone through the conversion.
** The percentages may not be correct, however, it is a good example of why it's stored like it is
-
17th February 2010, 04:45 AM #9
- Join Date
- Dec 2008
- Location
- New Zealand
- Posts
- 17,660
- Real Name
- Have a guess :)
Re: Understanding Linear Gamma
Possibly a good exercise for you to try (Katheo) - if you have an SLR with a DoF preview button is to stop your lens down 1 stop from wide open and then repeatedly press and release the DoF preview button whilst looking through the viewfinder. The almost inperceivable change in brightness is in fact a FULL HALVING of the light entering the lens!
-
17th February 2010, 04:16 PM #10New Member
- Join Date
- Feb 2010
- Posts
- 3
Re: Understanding Linear Gamma
Hmmm... maybe that's what I misunderstood. The data is captured linearly, then stored logarithmically? So, X photons = Y volts --> log value stored in binary memory in raw file --> gamma corrected in raw converter to adjust for human perception? Originally Posted by KentDub
-
17th February 2010, 06:02 PM #11
- Join Date
- Dec 2008
- Location
- New Zealand
- Posts
- 17,660
- Real Name
- Have a guess :)
Re: Understanding Linear Gamma
Not quite - a RAW capture is gamma 1.0 (linear) - it's converted to something else by a RAW converter at the time of the conversion (usually to something around gamma 2.2, but it depends on what the sliders are set to in the converter, as this tailors the conversion). Originally Posted by katheo
-
20th February 2010, 07:36 PM #12New Member

- Join Date
- Feb 2010
- Location
- New Braunfels, Texas
- Posts
- 4
- Real Name
- Tim Lookingbill
Re: Understanding Linear Gamma
The link to a discussion I started here:
http://luminous-landscape.com/forum/...howtopic=32880
will hopefully help you understand that bit depth allocation has more to do with you're ability to edit the image after exposure shooting in Raw and even that is more controlled by the software interpreting and allocating the appearance of such bits in an 8 bit video system.
I have not yet experienced any noticeable advantage Exposing To The Right in most of my outdoor shots with varied dynamic range. I don't see that much gain in detail editing ETTR shots. I find if you can get the incamera LCD's histogram to fall just a tad to the right of center, you have plenty of levels allocated to editing meaningful detail.
Exposure isn't the real problem here. It's how much light is available that is of primary concern. Sensors collect and measure photons and their level of sensitivity in capturing detail over noise when gathering these photons is quite unpredictable in low light and shadow areas.
You can still get noise in the shadows shooting a brightly lit midday scene and still not have enough levels to prevent posterization trying to pull detail out of these shadows. That's where the bit allocation comes in demonstrated in McQ's graph. Since there aren't that many photons to count in shadow areas and human vision can't really see that much detail in that tonal region anyway, the A/D convertor allocates more of the bit levels to the upper light regions that can be seen.
When the same scene turns overcast and slightly darker you won't get anymore detail in the same deep shadow area by increasing exposure because there aren't any additional photons to count. In fact there are far less.
Because of the varied dynamic ranges constantly presented to a digital camera's sensor it's best to just keep the histogram somewhere in the middle to prevent highlight blowouts. Over exposing just a little isn't going to allocate any noticeably more levels to viewable detail. Shadows will always have some level of posterization unless you give more lighting to them at the time of capture.

 Reply With Quote