
 Helpful Posts:
 Hi Everyone!
I am a research assistant and I need to image an object of size 10um. In order to make sure that my optical setup can actual capture that, I use a USAF chart to determine the resolution of my optical setup. I, however, get confused.
The following is the information of my optic setup:
Lens: Sigma Lens 70-300mm APO F4-5.6 DG MACRO
Camera: 3 Megapixel Sensor with a 1/2'' optical format. Sensor size: 6.55mm(H)x 4.92mm(V); Pixel Size: 3.2umx3.2um; Active Pixel: 2048H x 1536V;
Focal Length: 200mm
Focus Distance: 24cm
Extension Tube Length: 40cm
Aperature: f/16
Exposure Time: 10ms
A schematic of the optical setup is included in the uploaded pictures.
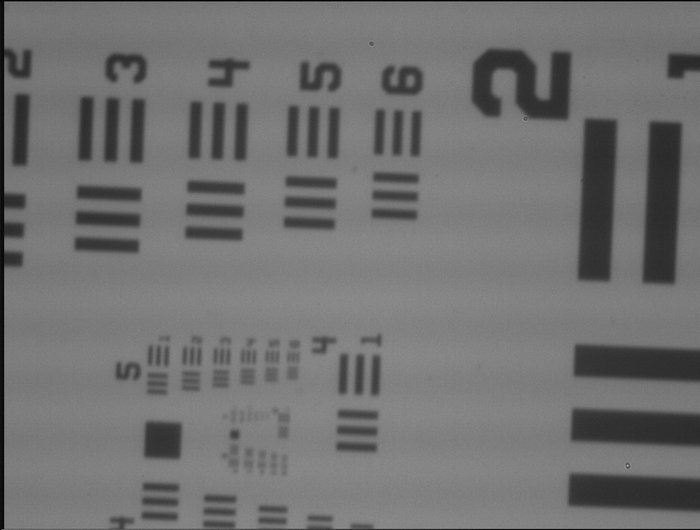
I then use the NI-MAX to obtain the video of USAF chart in greyscale mode and obtain pictures from the video. I upload one of the picture that I take. By simply looking at the graph, I can see that group 5, element 4 can be resolved, which is of size 11um.
I take the next step and write a labview program to measure the width of the element from the picture. With this program, I need to zoom in in the picture and draw a square around the element. The problem is that the elements tend to blur into each other after zooming into the picture.
My question is: What is causing the blur?
After I browse through all the basic knowledge, I have the following hypothesis:
1. Is the airy disk too big so that the nearby disks interfers?
2. The MTF of the lens around object size 10um is poor so that the lens can not resolve it perfectly which causes the blur.
I would really appreciate any advice that you guys give me!!!
Thanks!!!
Results 1 to 20 of 26
-
21st April 2015, 01:54 AM #1New Member

- Join Date
- Apr 2015
- Posts
- 3
How to explain the blurring while using a USAF chart to determine the resolution
-
21st April 2015, 07:35 AM #2

- Join Date
- Sep 2012
- Location
- Nomadic but not homeless, ex N.Z. now Aust.
- Posts
- 4,142
- Real Name
- Paul

Re: How to explain the blurring while using a USAF chart to determine the resolution
Keep every thing the same apart from changing the aperture to f11. It is under exposed.
Tripod? Mirror locked up? Remote cable release?
If you are trying to capture using video I think the results will remain disappointing.
Are you using a camera specifically designed for your work? Not an SLR?Last edited by pnodrog; 21st April 2015 at 07:46 AM.
-
21st April 2015, 08:23 AM #3

- Join Date
- May 2011
- Location
- Brisbane Australia
- Posts
- 4,636
- Real Name
- Dave Ellis
Re: How to explain the blurring while using a USAF chart to determine the resolution
Yes I'd be concerned with video capture too, you will probably lose resolution there. Also zooming the screen view in will probably involve upscaling above the captured resolution and the results could become un-usable. I also don't see why you couldn't use a wider aperture (say f/5.6 or f/8)) which should give better lens resolution by reducing diffraction. For macro work involving magnification factors of the order of one, the amount of diffraction for any given aperture size is greater than it would be for "normal photography" which involves much smaller magnification ratios.
My guess is that your test set-up is pushing the resolution limits of what you are trying to measure !
DaveLast edited by dje; 21st April 2015 at 09:00 AM. Reason: Added innformation
-
21st April 2015, 05:48 PM #4New Member
- Join Date
- Apr 2015
- Posts
- 3
Re: How to explain the blurring while using a USAF chart to determine the resolution
Thanks for your reply! The reason I use f/16 is that it would give a longer depth of field since the object that I'm trying to image is moving in and out of the frame...
The optical setup is specifically designed and it is just composed of a lens, extension tube, and a sensor... The setup is mounted on a sturdy structure ...
In your opinion, should I increase the magnification of my current setup so that I don't have to zoom in digitally? Thanks!
-
21st April 2015, 05:57 PM #5Moderator

- Join Date
- Mar 2012
- Location
- Ottawa, Canada
- Posts
- 21,956
- Real Name
- Manfred Mueller
Re: How to explain the blurring while using a USAF chart to determine the resolution
A few thoughts come to mind:
1. The sensor you are using has a small photosite, (smaller than on my D800 with a 4.89 micron pitch), I believe is diffraction limited at f/11 and higher. With a 3.2 micron pitch, I expect that you will be diffraction limited at a lower f-stop, so this could certainly be part of the issue.
2. Does the sensor you are using have an anti-alias filter? If so, this would definitely cause some softening.
3. You are using a 70-300mm lens and even while it may state it is a macro, I suspect that the lens designers were more than willing to sacrifice resolution in order to provide that zoom range. I would suggest going to a fixed focal length macro as this will definitely be more likely to be optimized for the type of work you are doing.
4. Image processing - how is that being done? Again certain commercial image processing engines do introduce pixel smearing as a way reducing chromatic noise.
5. Processing of the image you have posted. How was that handled. In "regular" photography sharpening algorithms are applied to sharpen the image. Look what happens when I run your image through Photoshop's Unsharp Mask filter:
Screenshot of original image:
Sharpened using unsharp mask
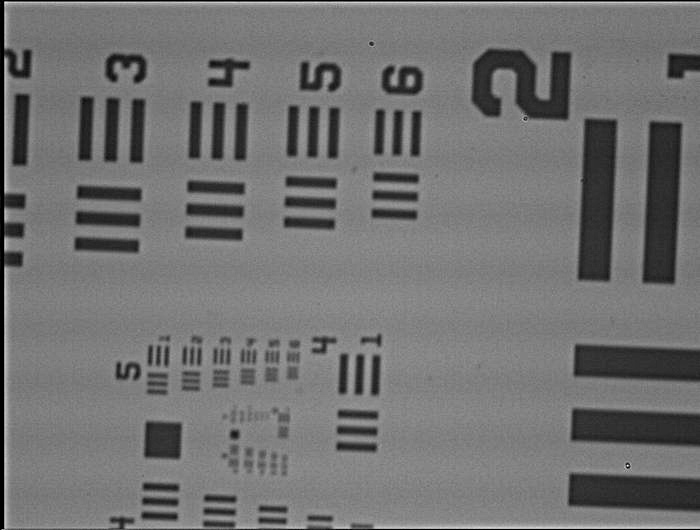
I hope this helps...Last edited by Manfred M; 21st April 2015 at 06:03 PM.
-
21st April 2015, 06:15 PM #6
- Join Date
- May 2014
- Location
- amsterdam, netherlands
- Posts
- 3,182
- Real Name
- George
Re: How to explain the blurring while using a USAF chart to determine the resolution
A 200mm lens with an extension tube of 400mm gives me an image distance of 600mm when focused at infinity. Originally Posted by EvanLiu

Using the diffraction calculator on this site and correcting the focal length for the image distance, I get an Airy disk of 63.9um. Quite a lot for a pixelsize of 3.2um.
George
-
21st April 2015, 07:21 PM #7
- Join Date
- May 2011
- Location
- Brisbane Australia
- Posts
- 4,636
- Real Name
- Dave Ellis
Re: How to explain the blurring while using a USAF chart to determine the resolution
Evan what magnification are you actually using ?
Why are you using video ? Is the object moving ?
What is the video resolution in pixels (ht by width) ?
Does the camera have an anti aliasing filter ?
-
23rd April 2015, 04:02 AM #8
- Join Date
- Dec 2011
- Posts
- 321
Re: How to explain the blurring while using a USAF chart to determine the resolution
You can buy a 16 mp camera for fifty bucks.
-
25th April 2015, 06:28 PM #9
- Join Date
- Feb 2012
- Location
- Texas
- Posts
- 6,956
- Real Name
- Ted
Re: How to explain the blurring while using a USAF chart to determine the resolution
Helpful as ever - and steadfastly measuring resolution in MP. Gotta love it Originally Posted by Richard Lundberg

-
25th April 2015, 11:01 PM #10
- Join Date
- Dec 2011
- Posts
- 321
Re: How to explain the blurring while using a USAF chart to determine the resolution
He's using a coke bottle now, spat
-
26th April 2015, 12:39 AM #11
- Join Date
- Feb 2012
- Location
- Texas
- Posts
- 6,956
- Real Name
- Ted
Re: How to explain the blurring while using a USAF chart to determine the resolution
Oh I see, lich Originally Posted by Richard Lundberg
-
26th April 2015, 10:04 AM #12

- Join Date
- Aug 2012
- Location
- S, B'ham UK
- Posts
- 3,337
- Real Name
- John
Re: How to explain the blurring while using a USAF chart to determine the resolution
Good point. I'm surprised no one has mentioned that the lens probably comes from 10mp APS days and wont be of much use on 1/2in format sensors witht this many pixels. It's doubtful if something more recent would be very good either.
A CCTV lens would probably give better results but for this sort of thing a machine vision lens is likely to be a lot better.
John
-
-
26th April 2015, 12:28 PM #13
- Join Date
- Feb 2012
- Location
- Texas
- Posts
- 6,956
- Real Name
- Ted
Re: How to explain the blurring while using a USAF chart to determine the resolution
Re: the Airy Disk effect, I found that for macro work the said disk is bigger than the standard calculation gives - because that calculation is for a lens at infinite focus. So, taking the lens extension to be equal to the focal length at 1:1 (simple assumption) the disk size is doubled. Then, in the OP, a 40cm [sic] extension is mentioned!!
'Spose the lens is set to f=200mm and 1:2 "macro" then that's something like 200mm + 100mm + 400mm = about 700mm from aperture to the film plane!! George013 has calculated the disk size for a similar distance and it is exceeding large. So, with those kind of numbers and the OP's stated use of f/16, it's quite surprising that the image shows any bars at all
See here for a review of that lens:
http://slrgear.com/reviews/showprodu...uct/230/cat/31
It has a really bad score for image quality and many of the reviews say that it's "soft".
One review said it would make a good research lab door-stop (just kidding, sorry).
Re: "I am a research assistant and I need to image an object of size 10um."
It would be nice to know the type of object and what is meant by "need to image" - in other words, what subject resolution is required? For example, scratches on watch casings can be around 10um wide but what if details of the valley of the scratch are needed, would we now be looking for 100nm subject resolution? (eek, wavelength alert . . . far UV microscopy, etc.).
A corollary is that, if we shoot a sparrow's head, say 20mm wide, what resolution is needed at the subject to make a sharp picture? 0.5mm? 0.2mm? Now relate that to something 10um wide . . hmmm . . . . still less than even near UV wavelength . .Last edited by xpatUSA; 26th April 2015 at 01:11 PM.
-
26th April 2015, 12:50 PM #14
- Join Date
- Aug 2012
- Location
- S, B'ham UK
- Posts
- 3,337
- Real Name
- John
Re: How to explain the blurring while using a USAF chart to determine the resolution
They use the same sums for resolution on microscopes Ted so I don't think distance matters - unliked photographic lenses though they (Nikon for instance) point out that for a number of reasons it wont be reached. One will be very reduced contrast levels, the other alignment and a few other things - including the objective itself going on one tested by a university that costs several thousand quid.
John
-
-
26th April 2015, 01:06 PM #15
- Join Date
- May 2014
- Location
- amsterdam, netherlands
- Posts
- 3,182
- Real Name
- George
Re: How to explain the blurring while using a USAF chart to determine the resolution
He is using a 200mm lens and a 400mm extension tube. The image distance becomes 600mm, that's 3 times as much. When focused at infinity you must calculate with a F-number of 3x16=48. And when focused at nearby even more.
George
-
26th April 2015, 02:28 PM #16
- Join Date
- Feb 2012
- Location
- Texas
- Posts
- 6,956
- Real Name
- Ted
Re: How to explain the blurring while using a USAF chart to determine the resolution
So, John and George,
Does distance matter, or does it not?
A question, George,
Image distance from what, may I ask?
-
26th April 2015, 02:39 PM #17
- Join Date
- Aug 2012
- Location
- S, B'ham UK
- Posts
- 3,337
- Real Name
- John
Re: How to explain the blurring while using a USAF chart to determine the resolution
The only effect is that the F ratio is changed by the extension tube - the rad of the spot is 1.22 * wavelength * focal length / lens diameter. Image distance is generally taken as not to matter. So with the set up the diffraction spot will increase by 240/200. Not that it matters because a lens of this nature is really unlikely to be capable of producing a sensible one anyway.
Sensible? Even with only a 1/4 wave error only 80% of the usual light actually gets into the diffraction spot. The missing part goes into the rings around it, Largely into the first one. While that doesn't sound significant contrast at diffraction spot sized l/mm is only about 7 1/2% for black and white so the missing 20% has a significant effect on that.
John
-Last edited by ajohnw; 26th April 2015 at 02:51 PM.
-
26th April 2015, 04:22 PM #18

- Join Date
- Dec 2013
- Location
- Florida USA/Dunstable Beds.
- Posts
- 1,435
- Real Name
- Brian Grant
Re: How to explain the blurring while using a USAF chart to determine the resolution
You are asking a lot from general photo gear.
How rigid is that extension tube and are the ends absolutely parallel to each other?
That sounds like a heavy combo. You should use really strong support here several places along the way.
You should also use the mirror lockup or delay function to stop vibration. VR can only do so much.
Another thing you might try is locking the shutter open in the dark and using flash illumination and then closing the shutter.
-
26th April 2015, 04:32 PM #19
- Join Date
- May 2014
- Location
- amsterdam, netherlands
- Posts
- 3,182
- Real Name
- George
Re: How to explain the blurring while using a USAF chart to determine the resolution
Well, there we go again: definitions.
Lens formule, 3 variables: object distance, focal length and image distance. All measured from the optical centre of the lens.
The formule of the Airy disk is a simplified formule. Where you mean the focal length should be image distance, the distance from optical center to the sensor. Only at infinity they are equal. All based on that the diafragma is in the optical centre.
George
-
26th April 2015, 04:58 PM #20
- Join Date
- Feb 2012
- Location
- Texas
- Posts
- 6,956
- Real Name
- Ted
Re: How to explain the blurring while using a USAF chart to determine the resolution
The tube is 400mm, not 40mm, but I get the idea . . . Originally Posted by ajohnw
I still have no idea what "image distance" means, however
Last edited by xpatUSA; 26th April 2015 at 05:05 PM.

 Reply With Quote