CAMERA HISTOGRAMS: LUMINOSITY & COLOR
This section is designed to help you develop a better understanding of how luminosity and color both vary within an image, and how this translates into the relevant histogram. Although RGB histograms are the most commonly used histogram, other types are more useful for specific purposes.
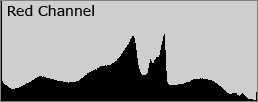
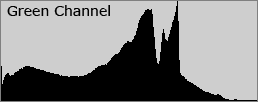
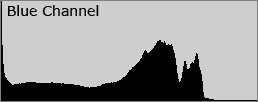
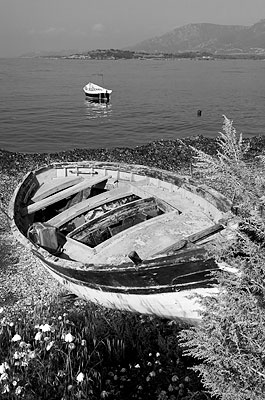
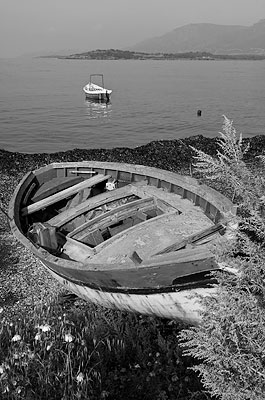
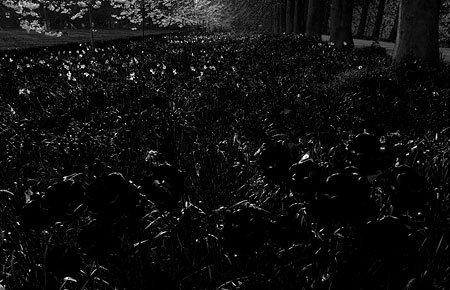
The image below is shown alongside several of the other histogram types which you are likely to encounter. Move your mouse over the labels at the bottom to toggle which type of color histogram is displayed. When you change to one of the color histograms a different image will be shown. This new image is a grayscale representation of how that color's intensity is distributed throughout the image. Pay particular attention to how each color changes the brightness distribution within the image, and how the colors within each region influence this brightness.
| Choose: | Red | Green | Blue | ALL |
Tap or mouseover image
to view as luminosity
LUMINANCE HISTOGRAMS
Luminance* histograms are more accurate than RGB histograms at describing the perceived brightness distribution or "luminosity" within an image. Luminosity takes into account the fact that the human eye is more sensitive to green light than red or blue light. View the above example again for each color and you will see that the green intensity levels within the image are most representative of the brightness distribution for the full color image. This also reflected by the fact that the luminance histogram also matches the green histogram more than any other color. Luminosity correctly predicts that the following stepped gradient gradually increases in lightness, whereas a simple addition of each RGB value would give the same intensity at each rectangle.
How is a luminance histogram produced? First, each pixel is converted so that it represents a luminosity based on a weighted average of the three colors at that pixel. This weighting assumes that green represents 59% of the perceived luminosity, while the red and blue channels account for just 30% and 11%, respectively. Move your mouse over "convert to luminosity" under the example image above to see what this calculation looks like when performed for each pixel. Once all pixels have been converted into luminosity, a luminance histogram is produced by counting how many pixels are at each brightness — identical to how a histogram is produced for a single color.
*Technical Note: Strictly speaking, these should really be called "luminosity histograms." Unfortunately, the terms "luminance" and "luminosity" are often used interchangeably, including by Photoshop, even though each describes a different aspect of light intensity. Luminance refers to the absolute amount of light emitted by an object per unit area, whereas luminosity refers to the perceived brightness of that object by a human observer.
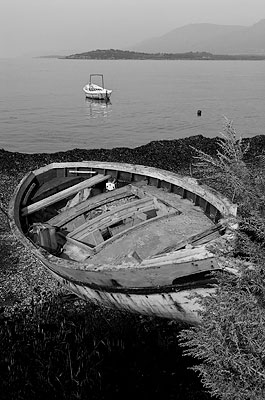
An important difference to take away from the above calculation is that while luminance histograms keep track of the location of each color pixel, RGB histograms discard this information. An RGB histogram produces three independent histograms and then adds them together, irrespective of whether or not each color came from the same pixel. To illustrate this point we will use an image which the two types of histograms interpret quite differently.
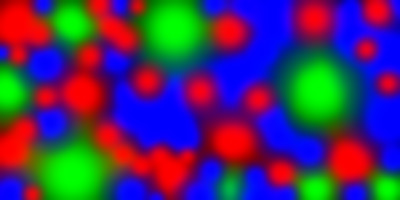
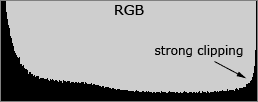
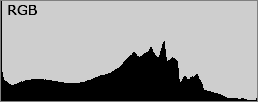
The above image contains many patches of pure color. At the interior of each color patch the intensity reaches a maximum of 255, so all patches have significant color clipping and only in that color. Even though this image contains no pure white pixels, the RGB histogram shows strong clipping—so much that if this were a photograph the image would appear significantly overexposed. This is because the RGB histogram does not take into account the fact that all three colors never clip in the same place.
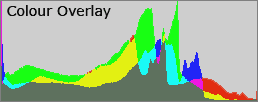
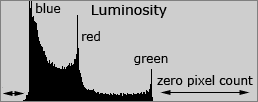
The luminance histogram tells an entirely different story by showing no pixels anywhere near full brightness. It also shows three distinct peaks—one for each color that has become significantly clipped. Since this image contains primarily blue, then red, then least of all green, the relative heights clearly show which color belongs where. Also note that the relative horizontal position of each peak is in accordance with the percentages used in the weighted average for calculating luminance: 59%, 30%, and 11%.
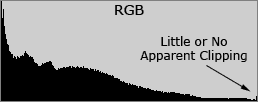
So which one is better? If we cared about color clipping, then the RGB histogram clearly warns us while the luminance histogram provides no red flags. On the other hand, the luminance histogram accurately tells us that no pixel is anywhere near full black or white. Each has its own use and should be used as a collective tool. Since most digital cameras show only a RGB histogram, just be aware of its shortcomings. As a rule of thumb, the more intense and pure the colors are in your image, the more a luminance and RGB histogram will differ. Pay careful attention when your subject contains strong shades of blue since you will rarely be able to see blue channel clipping with luminance histograms.
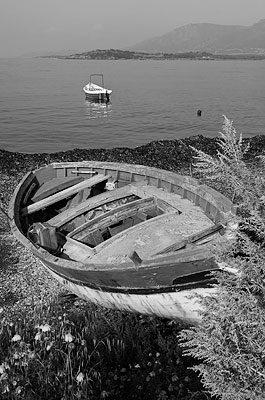
COLOR HISTOGRAMS
Whereas RGB and luminance histograms use all three color channels, a color histogram describes the brightness distribution for any of these colors individually. This can be more helpful when trying to assess whether or not individual colors have been clipped.
| View Channel: | Red | Green | Blue | ALL | Luminosity |
| View Histogram: | RGB | Luminosity |
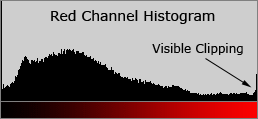
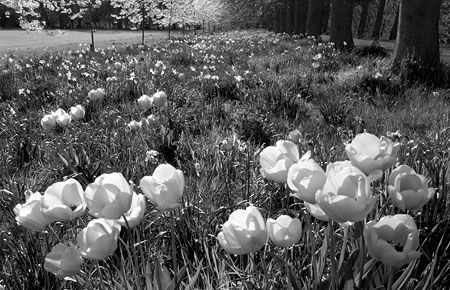
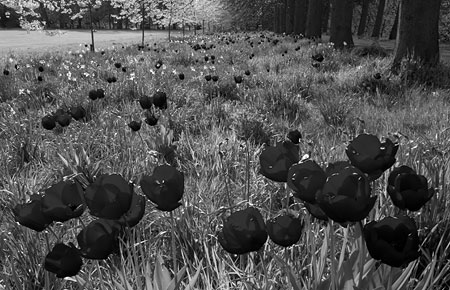
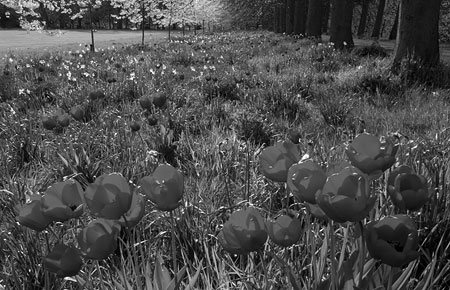
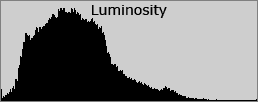
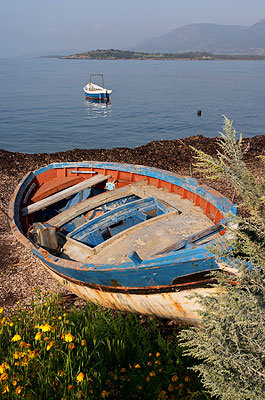
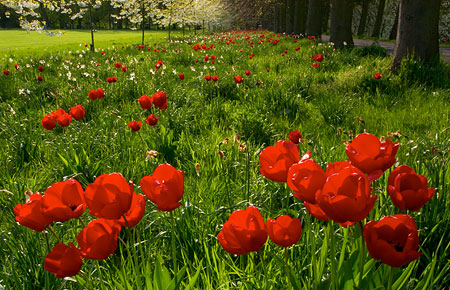
The petals of the red flowers caught direct sunlight, so their red color became clipped, even though the rest of the image remained within the histogram. Regions where individual color channels are clipped lose all texture caused by that particular color. However, these clipped regions may still retain some luminance texture if the other two colors have not also been clipped. Individual color clipping is often not as objectionable as when all three colors clip, although this all depends upon what you wish to convey.
RGB histograms can show if an individual color channel clips, however they do not tell you if this is due to an individual color or all three. Color histograms amplify this effect and clearly show the type of clipping. Move your mouse over the labels above to compare the luminance and RGB histograms, to view the image in terms of only a single color channel, and to view the image luminance. Notice how the intensity distribution for each color channel varies drastically in regions of nearly pure color. The strength and purity of colors within this image cause the RGB and luminance histograms to differ significantly.
For additional information on histograms, visit part 1 of this tutorial:
"Understanding Camera Histograms - Tones and Contrast"