CAMERA HISTOGRAMS: TONES & CONTRAST
Understanding image histograms is probably the single most important concept to become familiar with when working with pictures from a digital camera. A histogram can tell you whether or not your image has been properly exposed, whether the lighting is harsh or flat, and what adjustments will work best. It will not only improve your skills on the computer, but as a photographer as well.
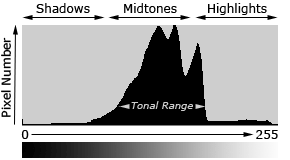
Each pixel in an image has a color which has been produced by some combination of the primary colors red, green, and blue (RGB). Each of these colors can have a brightness value ranging from 0 to 255 for a digital image with a bit depth of 8-bits. A RGB histogram results when the computer scans through each of these RGB brightness values and counts how many are at each level from 0 through 255. Other types of histograms exist, although all will have the same basic layout as the histogram example shown below.
TONES
The region where most of the brightness values are present is called the "tonal range." Tonal range can vary drastically from image to image, so developing an intuition for how numbers map to actual brightness values is often critical—both before and after the photo has been taken. There is no one "ideal histogram" which all images should try to mimic; histograms should merely be representative of the tonal range in the scene and what the photographer wishes to convey.
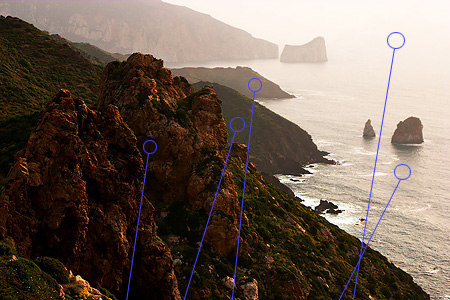
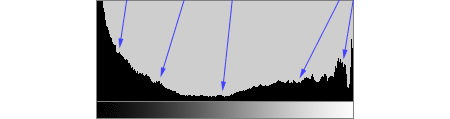
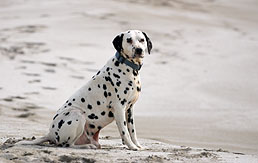
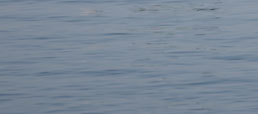
The above image is an example which contains a very broad tonal range, with markers to illustrate where regions in the scene map to brightness levels on the histogram. This coastal scene contains very few midtones, but does have plentiful shadow and highlight regions in the lower left and upper right of the image, respectively. This translates into a histogram which has a high pixel count on both the far left and right-hand sides.
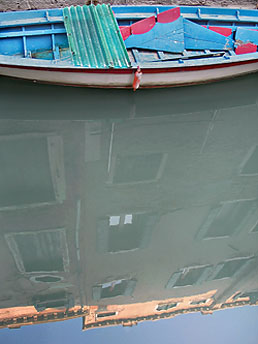
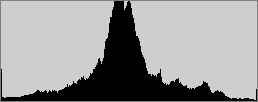
Lighting is often not as extreme as the last example. Conditions of ordinary and even lighting, when combined with a properly exposed subject, will usually produce a histogram which peaks in the center, gradually tapering off into the shadows and highlights. With the exception of the direct sunlight reflecting off the top of the building and off some windows, the boat scene to the right is quite evenly lit. Most cameras will have no trouble automatically reproducing an image which has a histogram similar to the one shown in the boat example.
HIGH AND LOW KEY IMAGES
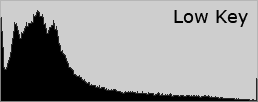
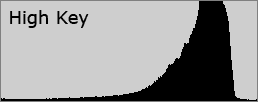
Although most cameras will produce midtone-centric histograms when in an automatic exposure mode, the distribution of peaks within a histogram also depends on the tonal range of the subject matter. Images where most of the tones occur in the shadows are called "low key," whereas with "high key" images most of the tones are in the highlights.
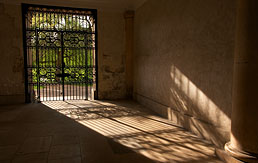
Before the photo has been taken, it is useful to assess whether or not your subject matter qualifies as high or low key. Since cameras measure reflected as opposed to incident light, they are unable to assess the absolute brightness of their subject. As a result, many cameras contain sophisticated algorithms which try to circumvent this limitation, and estimate how bright an image should be. These estimates frequently result in an image whose average brightness is placed in the midtones. This is usually acceptable, however high and low key scenes frequently require the photographer to manually adjust the exposure, relative to what the camera would do automatically. A good rule of thumb is that you will need to manually adjust the exposure whenever you want the average brightness in your image to appear brighter or darker than the midtones.
The following set of images would have resulted if I had used my camera's auto exposure setting. Note how the average pixel count is brought closer to the midtones.
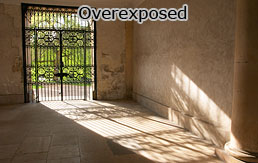
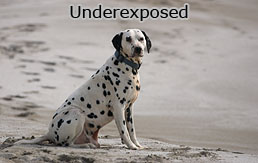
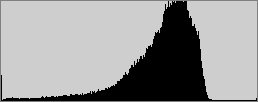
Most digital cameras are better at reproducing low key scenes since they prevent any region from becoming so bright that it turns into solid white, regardless of how dark the rest of the image might become as a result. High key scenes, on the other hand, often produce images which are significantly underexposed. Fortunately, underexposure is usually more forgiving than overexposure (although this compromises your signal to noise ratio). Detail can never be recovered when a region becomes so overexposed that it becomes solid white. When this occurs the highlights are said to be "clipped" or "blown."
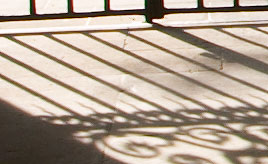
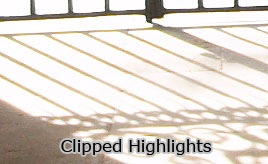
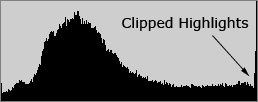
The histogram is a good tool for knowing whether clipping has occurred since you can readily see when the highlights are pushed to the edge of the chart. Some clipping is usually ok in regions such as specular reflections on water or metal, when the sun is included in the frame or when other bright sources of light are present. Ultimately, the amount of clipping present is up to the photographer and what they wish to convey.
CONTRAST
A histogram can also describe the amount of contrast. Contrast is a measure of the difference in brightness between light and dark areas in a scene. Broad histograms reflect a scene with significant contrast, whereas narrow histograms reflect less contrast and may appear flat or dull. This can be caused by any combination of subject matter and lighting conditions. Photos taken in the fog will have low contrast, while those taken under strong daylight will have higher contrast.


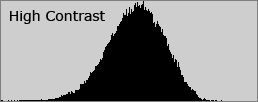
Contrast can have a significant visual impact on an image by emphasizing texture, as shown in the image above. The high contrast water has deeper shadows and more pronounced highlights, creating texture which "pops" out at the viewer.
Contrast can also vary for different regions within the same image due to both subject matter and lighting. We can partition the previous image of a boat into three separate regions—each with its own distinct histogram.
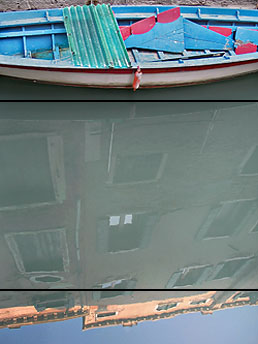
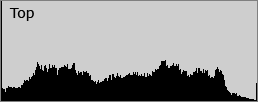
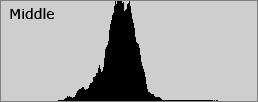
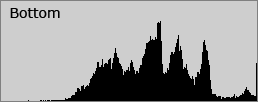
The upper region contains the most contrast of all three because the image is created from light which does not first reflect off the surface of water. This produces deeper shadows underneath the boat and its ledges, and stronger highlights in the upward-facing and directly exposed areas. The middle and bottom regions are produced entirely from diffuse, reflected light and thus have lower contrast; similar to if one were taking photographs in the fog. The bottom region has more contrast than the middle—despite the smooth and monotonic blue sky—because it contains a combination of shade and more intense sunlight. Conditions in the bottom region create more pronounced highlights, but it still lacks the deep shadows of the top region. The sum of the histograms in all three regions creates the overall histogram shown before.
For additional information on histograms, visit part 2 of this tutorial:
"Understanding Camera Histograms: Luminosity & Color"